

Invest in real estate. Build your future.
Take the guesswork out of building a diversified real estate portfolio - 100% done for you.


I'm ready to start investing.
I need some help.


$500 Million
In Equity Growth
$1 Billion
In Property Transactions
$1 Billion
In Property Transactions
$200 Million
In Revenue Collected
Invest In Cash Flowing Properties Today

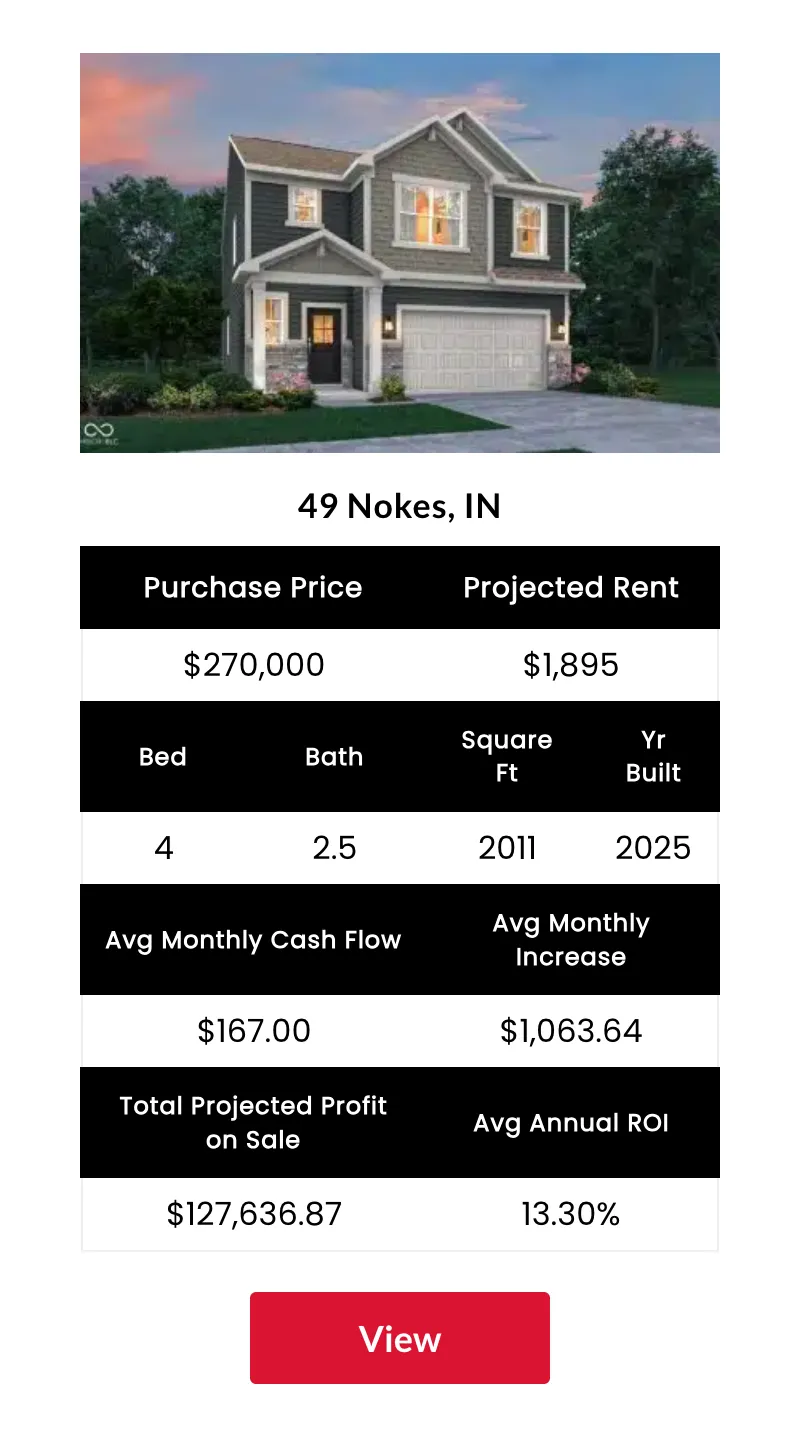
49 Nokes
Type: Single Family
Avg Mon Cashflow: $167
Avg Annual ROI: 13%
Where: Nokes, Indiana
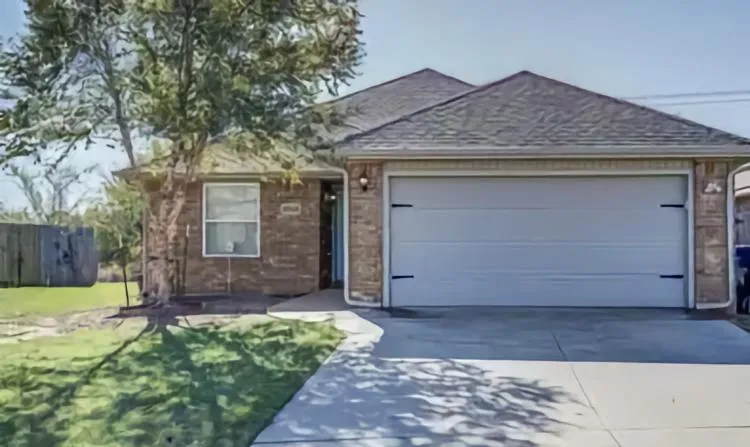
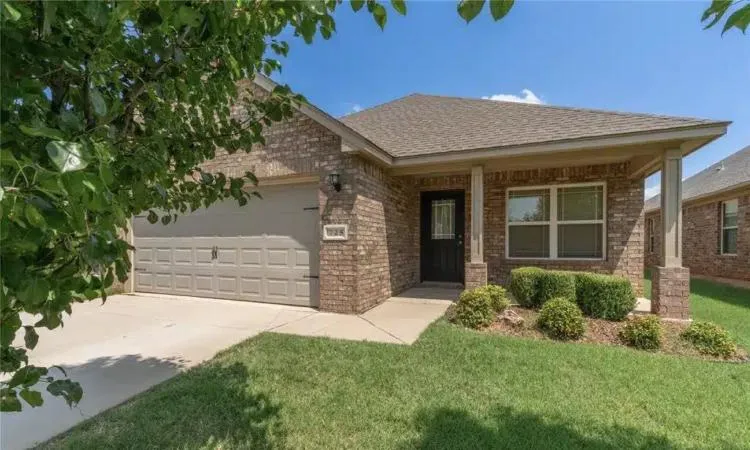
81st Oklahoma City
Type: Single Family
Avg Mon Cashflow: $489
Avg Annual ROI: 15%
Where: Oklahoma City, OK
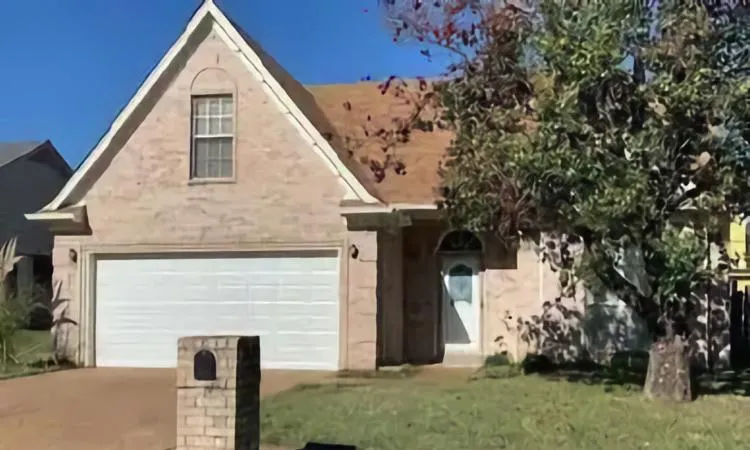
Anisetree
Type: Single Family
Avg Mon Cashflow: $396
Avg Annual ROI: 16%
Where: Anisetree, TN
Christian Yukon
Type: Single Family
Avg Mon Cashflow: $479
Avg Annual ROI: 15%
Where: Yukon, OK
Here's How It Works
Step 1
Create Your Real Estate Game Plan
Meet with our team to build your personalized real estate strategy. Whether you're starting with $5K or ready to invest $100K+, we'll help you choose the path that fits your goals and budget.
Step 2
We Handle the Heavy Lifting
We do 95% of the work - from finding properties and analyzing deals to managing tenants and maintaining properties. You keep 100% of the ownership & benefits while we handle everything else.
Step 3
Build Diverse Income Streams
Generate passive income through rental payments, build equity as properties appreciate, and take advantage of tax benefits - all without the traditional headaches of real estate investing.
Step 4
Scale Your Portfolio
As your confidence and portfolio grow, leverage our MBML+ membership to access exclusive deals, lower fees, and expert guidance to expand your real estate empire.


You Invest,
We Do The Rest
When we say “Done For You,” we mean it. Our expert team manages your entire real estate investment journey—from sourcing properties with our 35-point system, handling negotiations and closings, to ongoing property management and tax strategy. You build wealth without the hassle; we handle the details, you enjoy the returns.
Key Benefits of Investing with Done For you Real Estate
#1
Multiple Entry Points
Start where you're comfortable. With a range of price points and property types, you can begin building your portfolio at your own pace—without pressure, complexity, or guesswork.
#2
Done For You Service
Most companies stop at helping you find a property. We go further—handling acquisition, renovation, tenant placement, and ongoing management. You get the benefits of ownership, without becoming a landlord.
#3
Proven Track Record
We’ve guided thousands of clients through over $1 billion in real estate transactions. Our Moneyball Real Estate System has created over 400 real estate millionaires—by following the same time-tested playbook every time.
#4
Expert Team Support
You’ll work with a full team of real estate professionals—from deal finders and analysts to tax strategists and wealth planners. It’s like having a private family office for your portfolio.
#5
Reliable Approach
We don’t chase trends. We focus on stable markets, carefully vetted properties, and proven strategies that prioritize long-term outcomes over short-term hype.
#6
Boutique, Client Centered
We’re not a massive call center or faceless platform. We work with a select number of clients, providing white-glove service and personalized game plans. Your goals guide everything we do—and your success is how we measure ours.
Let’s Craft Your Real Estate Game Plan
Whether you’re ready to invest or just exploring your options, we’ll help you build a clear, customized roadmap.
What Our Investors Are Saying

Helping Hardworking Americans Build Real Wealth-One Property At A Time
Real estate shouldn’t be complicated, intimidating, or reserved for the few. That’s why we built a system where our team handles 95% (or more) of the work—so you can enjoy 100% of the ownership, control, and long-term benefits. Whether you’re starting small or scaling with confidence, we’ll help you build lasting wealth, on your terms and at your pace.
Ready to building your real estate Portfolio?
Frequently Asked Questions
How much money do I need to start investing with Done For You Real Estate?
We offer multiple entry points to match your goals and comfort level. Our traditional single-family investments typically begin around $85K in total out-of-pocket investments, but we also offer specialized, higher cash-flow properties and exclusive partnership opportunities that may start lower, or higher. Book a call and we’ll help you explore the best path based on your situation.
Does Done For You really handle everything for me?
Yes—95% or more. From property selection and acquisition to rehab, tenant placement, and management, we do the heavy lifting. You keep 100% of the ownership and benefits. We’ll walk you through the full process during your strategy session.
I'm interested but don't know where to start. Can you help?
Absolutely. That’s exactly what our free strategy sessions are for. We’ll learn about your goals, explain your options, and help you build a custom roadmap—whether you’re starting small or ready to scale.
How is Done For You different from other real estate investment companies?
Most firms give you a property and leave the rest to you. We offer a fully managed experience, guided by our proven Moneyball Real Estate System, which has helped create over 400 real estate millionaires. From education to execution, we’re with you every step of the way.
Can I use my retirement funds or other investment accounts?
Yes. Many clients invest using IRAs, 401(k)s, or other non-cash assets. During your strategy session, we’ll walk through your options and help you determine what’s possible.
What kind of returns can I expect?
Returns vary based on the market and your chosen strategy, but our focus is always on conservative, reliable growth. We’ll share real case studies and outcomes during your call, and in literature we send you, so you can see what’s possible for your situation.
Do I need real estate experience to work with DFY?
Not at all. Our system is built for busy professionals who want the benefits of real estate without becoming experts. We provide the education, strategy, and execution—you stay in control without having to learn it all yourself.
How long does it typically take to get started?
After your strategy session, most clients are investing within 30–60 days, depending on your investment path. We’ll guide you through each step to keep things simple and efficient.
What if I want to start small and scale up later?
That’s our specialty. With multiple entry points and a step-by-step growth plan, you can start where you're comfortable and build from there. We’ll help you define your goals and create a portfolio strategy that grows with you.
How do I know if real estate investing is right for me?
The best way to find out is with a no-pressure strategy call.We’ll ask a few questions, talk through your goals, and help you see if our approach is the right fit. Even if it’s not, you’ll walk away with clarity and valuable insights.

Real estate mastery in the palm of your hand.
Scan the QR code to join our community.
Real estate mastery in the palm of your hand.
Scan the QR code to join our community.


DFY Real Estate © 2025 - All Rights Reserved
590 Timpanogos Pkwy Orem, UT 84097
Done For You Real Estate USA (“DFY”) is a private real estate education and services company. We provide strategy guidance, property coordination, and educational tools to help clients pursue real estate investment goals. DFY is not a licensed real estate brokerage, investment advisor, or securities dealer, and we do not offer legal, tax, financial, or investment advice.
All content, tools, calculators, and services—whether provided on our website, through our events, software, emails, videos, or printed materials—are for educational and informational purposes only. Nothing should be interpreted as a solicitation, recommendation, or endorsement to buy or sell any investment, property, or financial product. We are not acting as an agent for any entity offering securities.
You alone assume responsibility for evaluating the risks and merits of any information we provide. DFY is not responsible for any decisions you make based on our materials. You agree not to hold DFY or any of its employees or affiliates liable for any loss or damages resulting from your financial decisions. We strongly encourage you to consult your own licensed tax, legal, and financial advisors before taking action.
Any examples, forecasts, or projections are illustrative only and should not be interpreted as guarantees of future performance. We do not and cannot promise any return on investment. Past performance is not indicative of future results, and results will vary widely based on timing, market conditions, creditworthiness, effort, and other variables beyond our control.
Testimonials shown are from real clients. Their experiences are not typical, and your outcomes may differ. Real estate investing involves risk, including the risk of losing capital. DFY is not a business opportunity or get-rich-quick program.
If you believe any part of our service or presentation conflicts with this disclaimer, please notify us so we can clarify or correct it. You agree to indemnify DFY against any claims or damages resulting from statements you make that misrepresent our role.
All property photos, tools, and illustrations shown are for informational purposes and may not reflect current availability or actual performance. All information is subject to change without notice.